
Data‑Driven EV Charging Station Siting in the U.S.: GIS and Traffic Analytics
The rapid adoption of electric vehicles (EVs) in the United States is transforming how planners, utilities, and private investors think about infrastructure. One of the most critical questions is where to place EV charging stations so they are convenient, profitable, and supportive of a resilient grid. Instead of relying on intuition or simple population statistics, more stakeholders are turning to data‑driven decision‑making, combining Geographic Information Systems (GIS) and advanced traffic analytics to identify optimal locations.
GIS and traffic data make it possible to evaluate multiple criteria at once: travel patterns, grid capacity, land‑use, socio‑economic indicators, and even tourism flows. This multi‑layered perspective is essential in the U.S., where travel behavior varies sharply between dense coastal cities, suburban corridors, and rural interstate segments. A gas station can thrive almost anywhere along a highway, but EV charging stations must be sited far more strategically to manage dwell times, grid constraints, and evolving user expectations.
Why Location Intelligence Matters for EV Charging
EV drivers are sensitive to range anxiety, charging time, and price. If charging locations are poorly distributed or inconveniently placed, adoption can slow, station utilization can remain low, and investors may hesitate. Location intelligence helps to answer key questions:
- Is there enough traffic volume to justify a station?
Traffic analytics use historical and real‑time data to understand vehicle flows on highways, arterials, and urban streets. Planners can see where EV‑compatible trips are concentrated and which corridors are underserved. - Are there existing amenities nearby?
GIS layers can include points of interest such as restaurants, retail centers, hotels, and workplaces. Since DC fast charging often requires 20–40 minutes, co‑location with amenities dramatically improves user experience and station competitiveness. - Can the local grid support fast charging?
Substation locations, feeder capacity, and distribution constraints can be mapped in GIS. This allows utilities and developers to weigh interconnection costs against demand potential for each candidate site. - How equitable is the charging network?
By integrating socio‑economic data (income, race, car ownership rates, and housing types), planners can avoid reinforcing inequities and instead prioritize underserved communities that may not attract purely market‑driven investment.
Key GIS Data Layers for EV Charging Site Selection
A modern, data‑driven siting study in the U.S. typically brings together a rich set of GIS layers:
- Road network and speed limits: To understand travel routes, commute patterns, and likely charging stops.
- Traffic counts and origin–destination data: To evaluate daily vehicle flows, peak periods, and corridor‑level demand.
- Existing charging infrastructure: Including public Level 2 and DC fast chargers, station power levels, and access restrictions.
- Land‑use and zoning information: To reveal where commercial, residential, industrial, and mixed‑use zones are located and whether new stations are legally permissible.
- Grid infrastructure: Substations, feeders, and known constraints or planned upgrades, ideally with approximate capacity data.
- Demographic and economic indicators: Population density, income, employment hubs, and EV adoption rates by region or ZIP code.
- Environmental and regulatory overlays: Flood zones, protected land, and local planning policies that might affect siting.
By stacking these layers, planners can quickly narrow down potential corridors and neighborhoods where demand, grid readiness, and regulatory conditions align.
The Role of Traffic Analytics and Big Data
Traditional traffic counts from roadside sensors or manual surveys provide only a snapshot. Today, big data sources—such as anonymized mobile location data, connected‑vehicle telemetry, and smart navigation platforms—offer a much more detailed picture:
- Origin–destination matrices reveal where trips start and end, showing how far drivers are traveling and where they might prefer to charge.
- Temporal patterns indicate when demand peaks: weekday commuting versus weekend leisure travel, seasonal tourism cycles, or special events.
- Route choice behavior helps identify the most frequently used interchanges, rest areas, and urban corridors.
These insights allow developers to:
- Prioritize high‑throughput locations that will sustain strong utilization.
- Identify “charging deserts” where high volumes of traffic pass through but public charging is scarce.
- Balance urban neighborhood chargers with highway fast‑charging hubs to support both local and long‑distance travel.
In the U.S., data from federal and state transportation agencies can be combined with commercial mobility datasets to build a comprehensive traffic picture at national, regional, and city scales.
Multi‑Criteria Decision Analysis (MCDA) for Optimal Siting
Because no single factor can determine the “best” location, many organizations use Multi‑Criteria Decision Analysis (MCDA) in a GIS environment. This involves:
- Defining criteria: For example, traffic volume, distance to existing chargers, grid capacity, land cost, proximity to amenities, and socio‑economic equity metrics.
- Weighting criteria: For a private operator, utilization and revenue may be weighted more heavily. A government or utility might give greater weight to equity or resilience.
- Normalizing and scoring each site: Each potential parcel, intersection, or corridor segment is evaluated against the criteria.
- Producing suitability maps: GIS software generates heat maps that highlight high‑priority zones and rank candidate sites for further assessment.
This structured approach makes the decision process transparent and repeatable, which is especially important when public funding—such as federal or state EV infrastructure grants—is being allocated.
U.S. Policy Context and Funding Landscape
In the United States, federal initiatives like the National Electric Vehicle Infrastructure (NEVI) Formula Program have accelerated interest in data‑driven siting. States are required to design Alternative Fuel Corridors, ensuring fast chargers at regular intervals along major highways. GIS and traffic analytics are essential tools for:
- Demonstrating that proposed station locations meet spacing, power, and redundancy requirements.
- Documenting that corridors will remain functional during peak travel seasons and under various growth scenarios.
- Supporting community engagement by visualizing how new stations will serve both local residents and through‑travelers.
Additionally, utilities and city governments often publish open datasets—such as load forecasts, substation locations, and EV adoption projections—that can plug directly into GIS workflows, improving the robustness of siting decisions.
Balancing User Experience, Grid Constraints, and Business Value
Data‑driven siting is not just a technical exercise; it is about aligning three perspectives:
- EV drivers:
- Short detours from main routes
- Predictable availability and minimal wait times
- Access to restrooms, food, and Wi‑Fi
- Safe, well‑lit locations
- Grid and utilities:
- Avoiding overloading feeders and transformers
- Minimizing costly upgrades where possible
- Leveraging demand response, energy storage, and renewable generation near sites
- Investors and operators:
- Achieving high utilization and revenue per charger
- Optimizing capital expenditure by selecting sites with favorable land and interconnection costs
- Future‑proofing for higher power levels and additional chargers
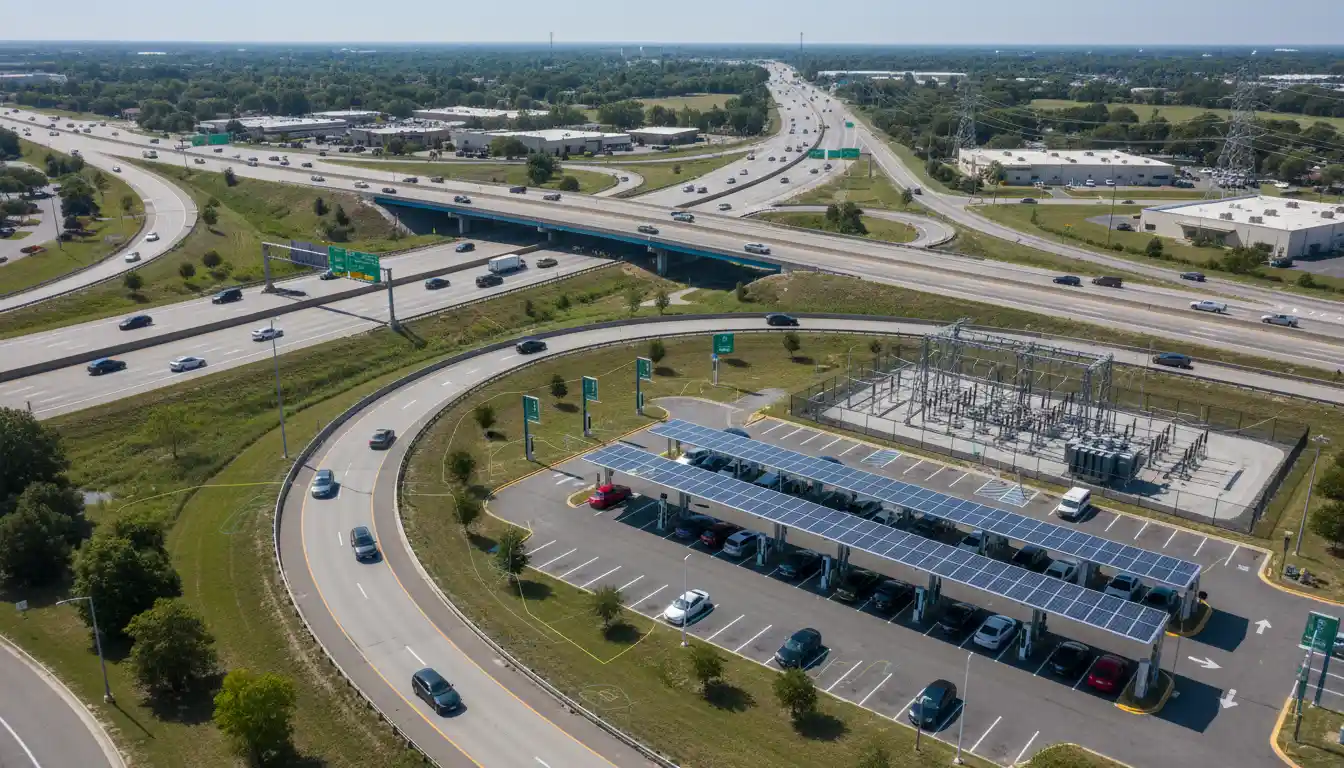
GIS and traffic analytics provide the shared evidence base that allows these interests to be reconciled. For instance, if a high‑traffic interchange sits at the edge of a constrained feeder, a slightly offset site—still convenient for drivers but connected to a stronger substation—may be identified as a better long‑term choice.
Future Trends: From Static Maps to Predictive Siting
The next wave of EV charging planning in the U.S. is shifting from static suitability maps to predictive and adaptive siting strategies. Emerging practices include:
- EV adoption forecasting: Integrating scenario‑based models of EV sales into GIS, so planners can see where demand is likely to surge and pre‑position infrastructure.
- Real‑time utilization feedback: Using operational data from existing stations to recalibrate models and identify when corridors are approaching saturation.
- Dynamic pricing and load management: Coordinating pricing strategies with grid constraints, so high‑demand locations remain reliable without expensive over‑builds.
- Integration with renewable energy: Siting charging hubs near solar farms, wind facilities, or microgrids, especially in rural or exurban areas.
As these capabilities mature, EV charging station planning will resemble a continuous optimization process rather than a one‑time infrastructure build‑out. Stakeholders who invest early in robust GIS and traffic analytics frameworks will be better prepared to scale networks efficiently and equitably.