
Diagnosing Windows Blue Screen of Death: A Comprehensive Guide to Minidump Analysis
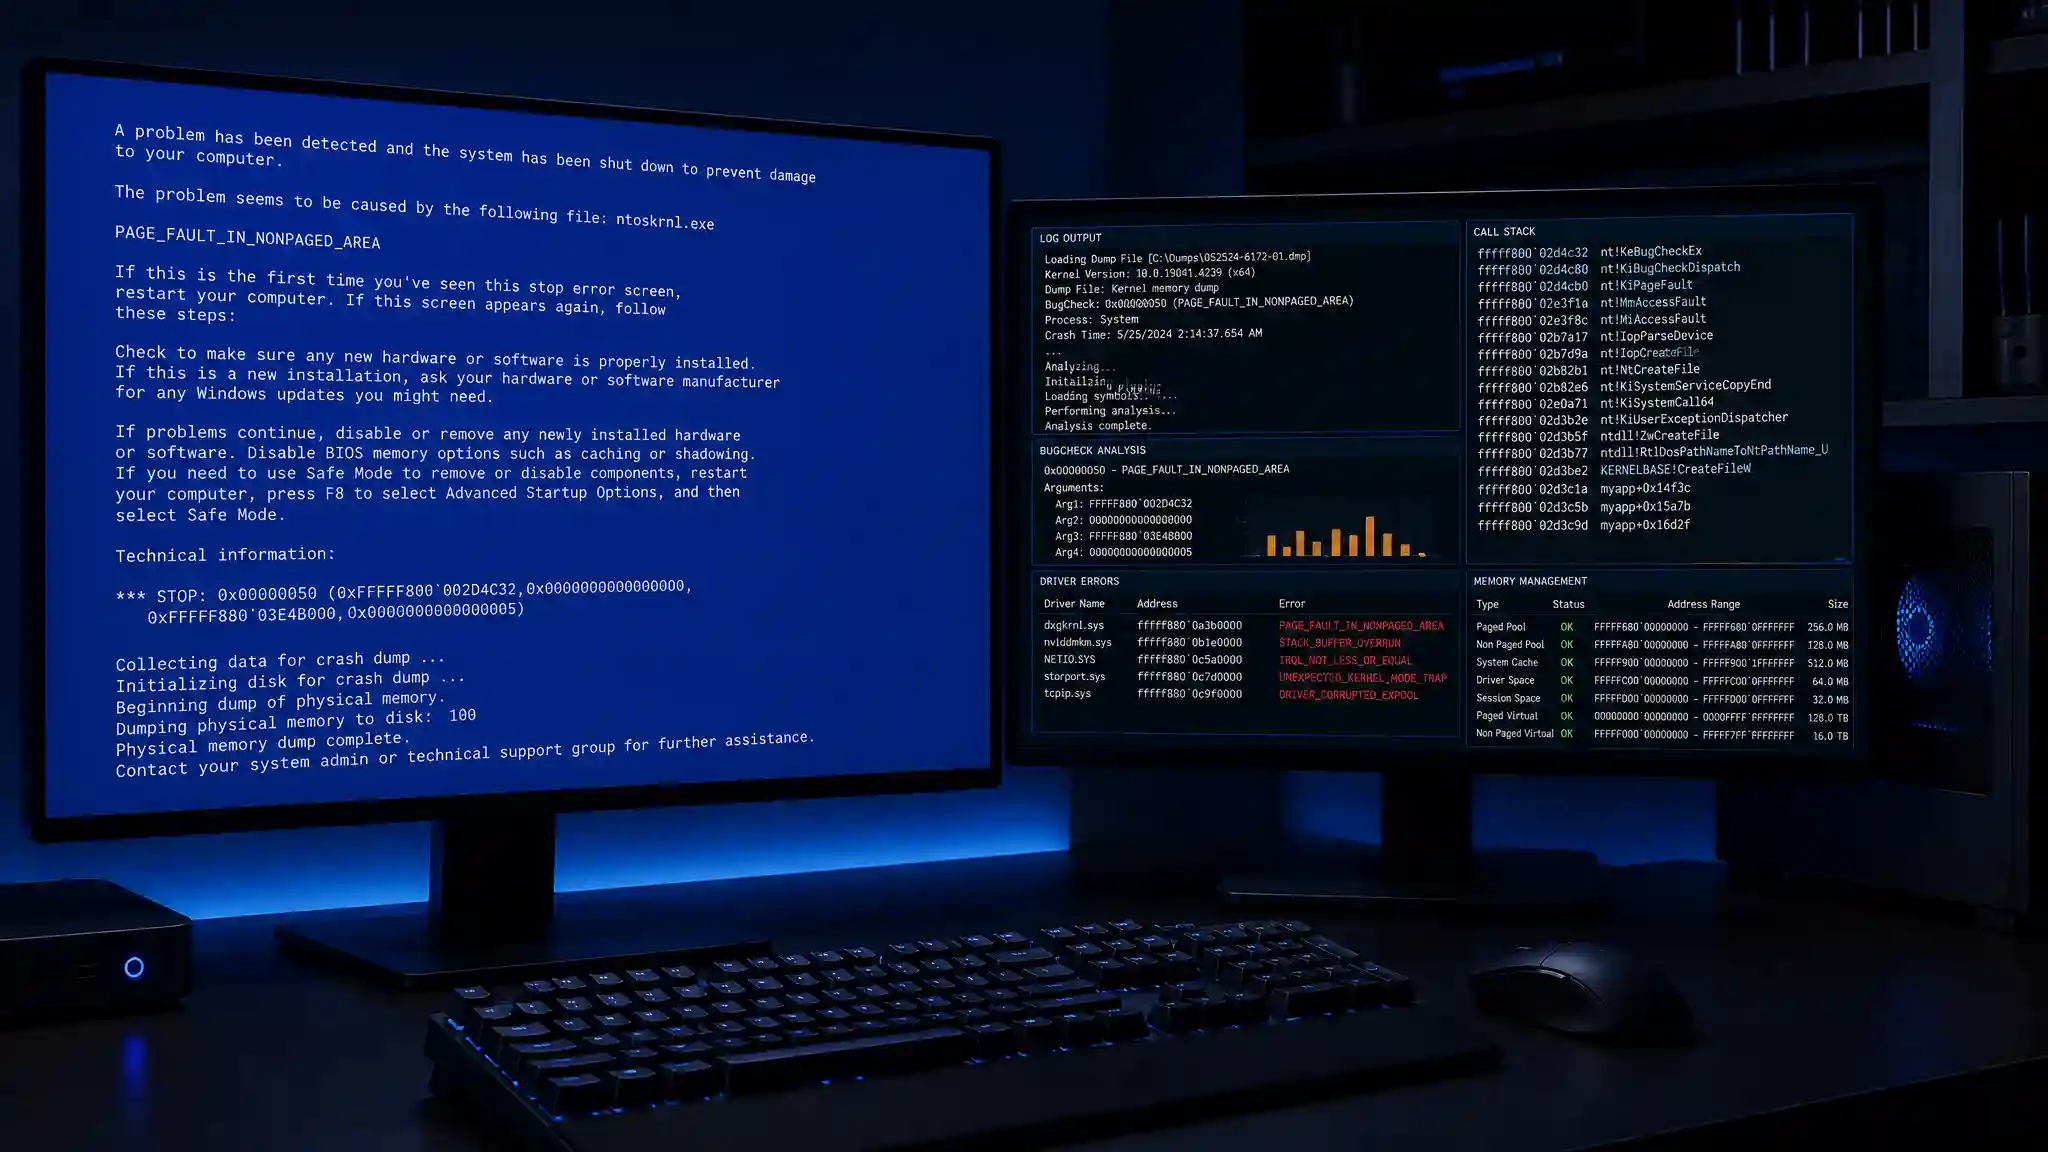
Experiencing a Blue Screen of Death (BSOD) disrupts your daily workflow in seconds. Your monitor turns blue, cryptic text flashes across the display, and Windows restarts abruptly. While this fatal system error feels catastrophic, your Windows operating system creates a detailed digital record of the failure. That diagnostic record is called a minidump file. Mastering minidump analysis transforms random troubleshooting guesswork into precise, actionable technical problem solving.
What Causes a Windows Blue Screen of Death
Windows triggers a stop code when the operating system encounters a critical state compromising stability. Instead of risking severe data corruption across storage drives, the kernel initiates an immediate safety shutdown sequence. Hardware failures, corrupted system drivers, incompatible memory modules, overheating processors, and failing storage drives trigger these sudden kernel crashes.
When this critical failure occurs, Windows writes vital memory information to your local drive before rebooting. This dump file preserves processor context records, active thread execution details, stack traces, and loaded driver lists. Instead of saving gigabytes of physical RAM, a small memory dump records only the essential diagnostic telemetry required to isolate the exact root cause efficiently.
Configuring Windows to Save Minidump Files
Before analyzing crashes, you must configure Windows to generate small dump files properly. Open the standard Windows Control Panel, navigate to Advanced System Settings, and locate Startup and Recovery. Click Settings to inspect the system debugging configurations.
Under the Write Debugging Information dropdown menu, choose Small Memory Dump (256 KB). Ensure the dump directory path points directly to %SystemRoot%\Minidump. Uncheck the option for Automatic Restart if you want adequate time to read the initial bugcheck string on your monitor. Click OK and apply the changes. Windows will now store future crash logs neatly inside C:\Windows\Minidump.
Essential Diagnostic Tools for Minidump Analysis
Modern diagnostic troubleshooting relies on specialized debugging utilities designed to interpret binary memory artifacts. Microsoft provides official developer tools, while independent developers offer lightweight alternatives for rapid triage.
WinDbg Preview stands as the premier industry benchmark for deep kernel debugging. Available directly through the Microsoft Store, WinDbg connects seamlessly to the Microsoft Symbol Server to map memory addresses to readable function names and driver routines.
BlueScreenView by NirSoft offers a rapid alternative for quick inspections. It automatically scans your default minidump directory, displaying crash timestamps, bug check codes, dump parameters, and the specific driver filename highlighted clearly in red.
WhoCrashed delivers user-friendly automated crash reports. It evaluates memory crash files and provides plain-English explanations regarding whether third-party software, corrupted kernel components, or failing physical hardware caused system failure.
Step-by-Step Minidump Analysis with WinDbg
To analyze your crash logs with maximum technical precision, launch WinDbg with administrative privileges. Click File, select Start Debugging, and choose Open Dump File. Navigate to C:\Windows\Minidump and select your recent .dmp file.
Once the debugger loads the raw dump package, configure the Microsoft public symbol path if prompted. WinDbg downloads symbol files (.pdb) to decode the crash context accurately.
Locate the interactive command line prompt at the bottom of the workspace and type:
!analyze -v
Press Enter to execute the automated verbose analysis engine. WinDbg reads the bugcheck code, inspects the faulting instruction pointer, unwinds the call stack, and evaluates active registers. Within seconds, the output displays the exact module name, the faulting driver, execution context, and failure bucket ID.
Interpreting Common Stop Codes and Faulty Drivers
The analysis output highlights crucial diagnostic markers that reveal the culprit behind the crash.
A bug check like 0x0000000A (IRQL_NOT_LESS_OR_EQUAL) indicates a kernel-mode process attempted to access pageable memory at an invalid interrupt request level. This error frequently points toward faulty graphics card drivers, outdated network adapter firmware, or conflicting antivirus kernel filters.
The stop code 0x0000003B (SYSTEM_SERVICE_EXCEPTION) suggests an unhandled exception occurred in system service routines, often tied to outdated display drivers, corrupted system components, or misbehaving input drivers.
If you observe 0x0000007E (SYSTEM_THREAD_EXCEPTION_NOT_HANDLED) alongside third-party modules like nvlddmkm.sys or amdkmdag.sys, your dedicated graphics processing unit drivers caused an illegal operation. Reinstalling GPU software using a clean display driver uninstaller resolves instability.
When ntoskrnl.exe appears as the crashing component, do not assume core files are defective. The core Windows kernel crashes as a secondary victim because an external driver corrupted memory space, or physical memory chips encountered read-write parity errors.
Resolving Underlying Hardware and Software Conflicts
Once your minidump analysis pinpoints the problematic component, take immediate remediation steps.
For software conflicts, boot your computer into Windows Safe Mode. Roll back recently updated drivers, uninstall newly installed peripheral utilities, and run System File Checker by executing sfc /scannow in an elevated terminal prompt.
For persistent crashes indicating memory management faults (0x0000001A), run Windows Memory Diagnostic or MemTest86. Defective RAM modules produce unpredictable kernel errors that no software tweak can fix. Replacing faulty RAM sticks or reseating modules inside motherboard DIMM slots restores complete stability.
Recommended Amazon Product
Crucial Pro RAM DDR5 / DDR4 Desktop Memory Kit (Amazon.com)
This popular and reliable hardware upgrade option can help address blue screen errors caused by RAM-related hardware problems, including 0x0000001A (MEMORY_MANAGEMENT), which frequently appears during minidump analysis. Upgrading or replacing faulty memory modules may improve overall system stability.