
Log Management in Software Projects: Global Standards, Tools, and Best Practices
In the modern era of distributed systems and cloud-native architectures, software development has evolved far beyond simply writing functional code. As applications become more complex, the ability to observe, troubleshoot, and optimize them in real-time has become a critical requirement. This is where log management enters the frame. Log management is not just a diagnostic necessity; it is the backbone of observability, security, and operational excellence in software engineering.
The Evolution of Logging: From Text Files to Observability
Historically, logging was a straightforward process. Developers would write status messages to a local .log file on a server, and when something went wrong, a sysadmin would SSH into the machine and use commands like grep or tail to find the error. However, in today’s world of microservices, Kubernetes clusters, and serverless functions, this manual approach is impossible. A single user request might travel through dozens of different services, each generating its own data.
Modern log management is the process of dealing with the high volume of log data generated by applications and infrastructure. It involves collection, aggregation, parsing, storage, analysis, and visualization. The goal is to transform raw, unstructured strings of text into actionable insights that help teams maintain high availability and performance.



Global Standards and Structured Logging
The first step toward professional log management is standardization. Without a standard format, logs from different systems cannot be easily compared or searched. The industry has moved toward “Structured Logging,” which typically uses JSON (JavaScript Object Notation) as the primary format. Unlike plain text, structured logs allow developers to attach metadata—such as user_id, request_id, environment, and severity_level—as searchable fields.
Another global standard is the use of standardized log levels. Following these levels consistently across a project ensures that monitoring tools can trigger the right alerts:
- DEBUG: Detailed information for diagnosing problems during development.
- INFO: Confirmation that things are working as expected.
- WARNING: An indication that something unexpected happened, but the app is still working.
- ERROR: A serious issue that prevented a specific function from completing.
- CRITICAL: A failure that might cause the entire application to crash.
Furthermore, the adoption of OpenTelemetry has become a global standard for observability. It provides a vendor-neutral set of APIs and SDKs that allow projects to collect logs, metrics, and traces in a unified way, preventing vendor lock-in.
The Log Management Lifecycle
To implement an effective strategy, software projects must follow a structured lifecycle:
- Instrumentation and Generation: This is the “writing” phase. Developers use logging libraries (like Log4j for Java, Winston for Node.js, or Serilog for .NET) to generate logs within the code.
- Collection and Transport: Once logs are generated, they need to be moved. Tools called “log shippers” or “agents” (like Fluentd or Logstash) reside on the host and send the data to a centralized repository.
- Centralization and Storage: Logs are stored in a high-performance database capable of handling massive write speeds. Because log data grows exponentially, many teams use “hot” storage for recent logs and “cold” storage (like AWS S3) for long-term compliance archiving.
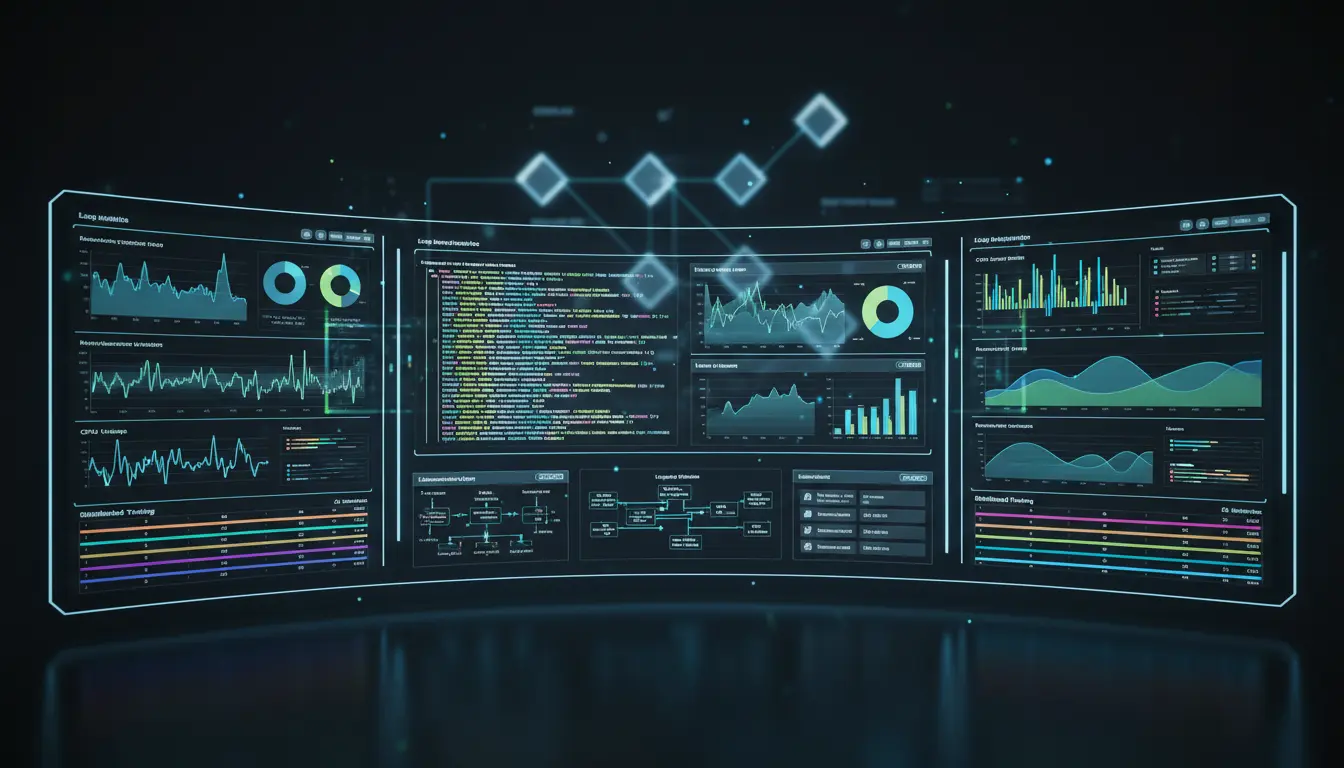
- Analysis and Visualization: This is where the data becomes useful. Dashboards allow teams to see trends, such as a sudden spike in 500-series errors after a new deployment.
- Alerting: Automated systems monitor the logs and notify the engineering team via Slack, PagerDuty, or email when specific patterns or thresholds are met.
Leading Tools in the Global Market
The ecosystem for log management is diverse, ranging from open-source stacks to fully managed SaaS platforms.
The ELK Stack (Elasticsearch, Logstash, Kibana):
The ELK stack is the gold standard for open-source log management. Elasticsearch acts as the search engine, Logstash handles the processing, and Kibana provides the visualization. Many enterprises use the managed version, Elastic Cloud, to reduce operational overhead.
Grafana Loki:
Loki is a relatively newer player that has gained massive popularity in Kubernetes environments. Unlike Elasticsearch, which indexes the full text of logs, Loki only indexes metadata. This makes it significantly more cost-effective and faster for high-scale environments where logs are primarily used for debugging alongside Prometheus metrics.
Datadog and New Relic:
These are comprehensive “Observability Platforms.” They offer seamless integration between logs, traces, and metrics. While they are more expensive than self-hosted solutions, they provide out-of-the-box dashboards and AI-driven anomaly detection that can save hundreds of engineering hours.
Splunk:
Splunk is often the choice for large-scale enterprise security (SIEM). It is incredibly powerful for searching through petabytes of data and is widely used for compliance and security auditing, though its licensing costs can be prohibitive for smaller startups.
Security and Compliance: A Critical Aspect
Log management is not just about fixing bugs; it is a legal and security requirement. Regulations like GDPR, HIPAA, and PCI-DSS require organizations to maintain audit trails of who accessed what data and when.
However, logging can also be a security risk. “Log Injection” attacks occur when malicious users input data that is then executed or misinterpreted by the logging system. Additionally, developers must be careful not to log “Personally Identifiable Information” (PII) or secrets like passwords and API keys. Modern log management tools often include “masking” or “obfuscation” features to automatically redact sensitive data before it reaches the storage layer.
Best Practices for Scalable Logging
To ensure that your log management system remains an asset rather than a bottleneck, consider these best practices:
- Correlation IDs: In microservices, every request should be assigned a unique ID. This ID should be passed through every service call and included in every log message. This allows a developer to see the entire journey of a single request across the whole system.
- Don’t Log Everything: While it’s tempting to log every variable, this leads to “log noise” and high costs. Focus on logging state changes, errors, and significant business events.
- Automate Retention Policies: Define how long logs should be kept. For example, keep detailed debug logs for 7 days, but keep security audit logs for 1 year.
- Context is King: A log message that says “Error occurred” is useless. A log message that says “Failed to process payment for User 552 due to Timeout on Gateway X” is actionable.
Conclusion
Log management is the “black box” flight recorder of the software world. As we move toward more autonomous and complex systems, the ability to parse through the digital noise to find the signal is what separates successful engineering teams from those constantly fighting fires. By adopting global standards like structured logging and OpenTelemetry, and leveraging powerful tools like the ELK stack or Loki, organizations can ensure their software projects are resilient, secure, and highly observable.